
- Docs
- /
Fragmentation and Defragmentation
29 Apr 2021 48839 views 0 minutes to read Contributors ![]()
Fragmentation and Defragmentation In SQL Server
Introduction
We may have wonder why when we first deploy your SQL Server with perfectly designed indexes, performance couldn’t be better, but after some time in operation, the database performance begins to get slower and slower? This could be because of heavily fragmented indexes, which can degrade query performance and cause your application to respond slowly. Over time as the database grows, pages split, and data is inserted, updated, and deleted, indexes become fragmented.
Index fragmentation should not be confused with OS or disk fragmentation. Such fragmentation can be referred to as external fragmentation, while index fragmentation is internal. Index fragmentation is when the pages are not contiguous, and thus the disk access requires more operations. This internal fragmentation occurs when inside the data file the logical ordering no longer matches the physical ordering of the index pages. Sometimes when the pages are out of order, this can result in wasted space, with even one entire extent containing one record on a page.Data can be spread out over many extents without any order to them.
Imagine searching for records when they’re all over the place and how much longer that search would take. There can be numerous hits to disk (Reads per Sec, where the data is stored) when there are many extents, resulting in disk thrashing and the process of moving data into and out of virtual memory (a process also called swapping pages). Because data has to be transferred back and forth from the hard drive to the physical memory, disk thrashing considerably slows down the performance of a system.
Sincefragmentation is a expected condition, we have few dmv’s and dbcc commands which can detect and diagnose the problem on busy OLTP system.
In this Blog we will be covering up these topics in details on how to detect and diagnose the problem.
Detecting fragmentation
Before we decide that what we can we do to defragment an index,it is required to analyze the indexes to find out the degree of fragmentation.We can use sys.dm_db_index_physical_statsdmv to find out the degree to which indexes has been fragmentated.
We will look the below example to find out how we can use this dmv to get the output: -

We can see that in the output of the above query that we are trying to join sys.dm_db_index_physical_statswithothersystem tableslike sys.tables and sys.schemas and sys.indexes to get the desired field values and which provide us useful information. Below are the
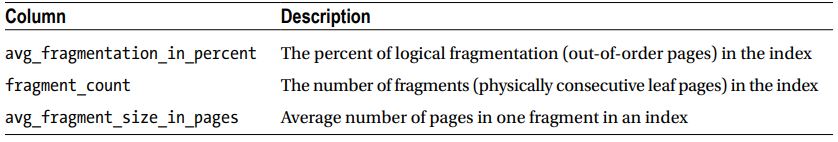
Below is the description of the columns
avg_page_space_used_in_percent shows the average percentage of the data storage space used on the page. This value allows you to see the internal index fragmentation.
avg_fragmentation_in_percent provides you with information about external index fragmentation. For tables with clustered indexes, it indicates the percent of out-of-order pages when the next physical page allocated in the index is different from the page referenced by the next-page pointer of the current page. For heap tables, it indicates the percent of out-of-order extents, when extents are not residing continuously in data files.
fragment_count indicates how many continuous data fragments the index has. Every fragment constitutes the group of extents adjacent to each other. Adjacent data increases the chances that SQL Server will use sequential I/O and Read-Ahead while accessing the data.
Before we discuss on how to define strategies to defragment the Indexes. We need to understand few terms.
Fill Factor
The read performance of an index is directly proportional to the fill factor, and write performance is inversely proportional to the fill factor. An index’s fill factor specifies the percentage that the index data pages on disk are filled when the index is first created. An index fill factor set to 0 or 100 percent will cause each index data page to be completely filled up.This is ideal from a disk capacity standpoint because there is no wasted space with data pages that are not fully allocated. However, this is not ideal from a SQL Server performance perspective regarding data updates (inserts, updates, and deletes). If you create a clustered index that has a fill factor of 100 percent, every time a record is inserted, deleted, or even modified, page splits can occur because there is likely no room on the existing index data page to write the change. Page splits increase I/O and can dramatically degrade SQL Server performance.
A lower fill factor will reduce the number of page splits. However, it is easy to react by simply applying a fill factor of, say, 50 percent to reduce page splits in a highly transactional system. The problem with this approach is that by doing this, you have in effect doubled the amount of data required to read and cache index information for a table. So, in improving write performance, you have potentially degraded read performance. The trick is to find the right balance between read and write performance by optimizing the fill factor settings for each index.
In order to set the fill factor we should continuously monitor the performance as whether heavy reads, writes, or a mixture of both is required, you can use the following numbers as a general starting point:
- If your database is read-only (low number of updates), use a fill factor of 100 percent or 0 percent.
- If your database is write-intensive (writes greatly exceed reads), use a fill factor somewhere between 50 percent and 70 percent.
- If your database is both read- and write-intensive, start with a fill factor of 80 percent to 90 percent.
The fill factor settings depend on the use of the table. Even where SQL Server is update intensive, if a specific table is used only for lookups, for example, then its clustered index can have a fill factor of 100 percent. Furthermore, for indexes that consume fewer than 100 pages, the fill factor settings are likely to yield insignificant results.
Below is the output where we can get the information about index fill factor.
Page Split Tracking
When there is no space left on a data page for more inserts or updates, SQL Server moves some data from the current data page and moves it to another data page. So, if a new row is inserted onto an already full page, moving data to another page is done in order to make space for the new rows, and the data now spans multiple data pages.
The page split is moving the data from one page to a new one, and the span is the result. Although page splits are a normally occurring process in an OLTP system, too many page splits can cause performance issues that will slow down your system because of fragmentation. Page splits are an expensive operation; therefore, the fewer page splits you have, the better your system will perform.
The traditional way to monitor and evaluate page splitting activity is using the Performance Monitor counter Page Splits/sec. The Page Splits/sec counter is likely to increase proportionately as workload activity on the server increases. The Page Splits/sec counter measures the number of times SQL Server had to split a page when updating or inserting data, per second. This counter is cumulative of all databases and objects in that server. It does not have any breakdown.
You can find the page splits/sec counter in the sys.dm_os_performance_counters DMV with the following query
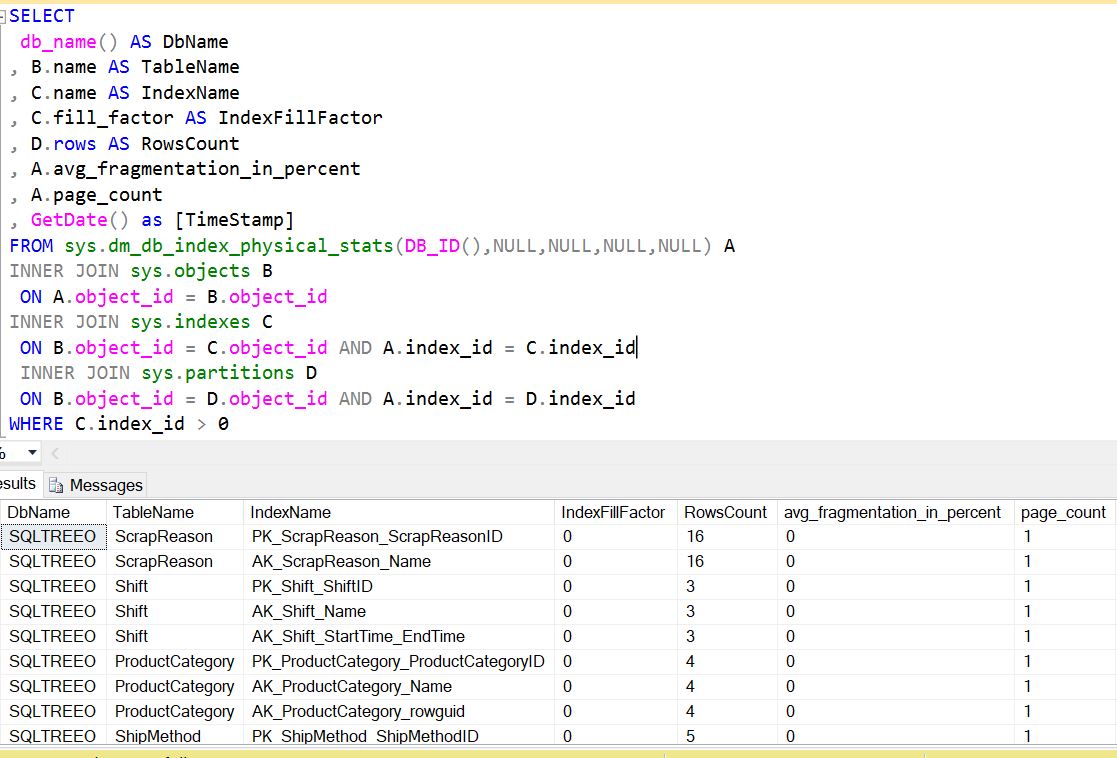
The reason why too many page splits can decrease the performance of SQL Server is because of the large number of I/O operations. One solution is to deploy a faster I/O subsystem, where page splits would be less of an issue. Of course, throwing hardware at the problem can be an expensive and temporary Band-Aid. Page splits can also show up as a resource wait when pages highly in demand during page splitting can cause in-memory contention and show up as page latches. So, by examining waits as well, you can identify one of the common symptoms of excessive page splitting.
one way to tell whether excessive page splits exist on the system is to look at wait stats. High wait times for latch-wait statistics is one possible indication of too many page splits. The latches are held in EX (exclusive) mode and therefore will show up in the waiting queue as PageLatch_EX.
PageLatch_EX is not an I/O request. Rather, it occurs when a task is waiting on a latch for a buffer and can cause contention of access to the in-memory pages. In other words, while page split operations are occurring, the latches will hold the pages in memory and not release them until the operation is complete.
Resolving Fragmentation (Defragmentation)
Defragmentation is the process of Resolving the fragmentation of indexes which are judged as highly fragmented indexes and causing slowness. We basically have 2 methods by which we can remove fragmentation.
- Rebuild Index.
- Reorganize Index.
Let’s discuss both of these methods with example:-
1)Rebuild Index
Rebuilding indexes completely drops and re-creates the database indexes. Technically, rebuilding consists of copying, renaming, and dropping the old one, internally. This is one of the operations you will perform to defragment your indexes since you are rebuilding them and realigning the physical and logical order of the index rows in contiguous pages from scratch. Fragmentation is eliminated, pages are compacted together, and disk space is reclaimed.
The fill factordetermines how the data in the pages is allocated. By specifying "ALL", all the indexes on a table are dropped and rebuilt in a single transaction.
This operation requires lots of disk space.You should be OK if you have 1.5 to 2 times the space of the largest index as an initial guideline.
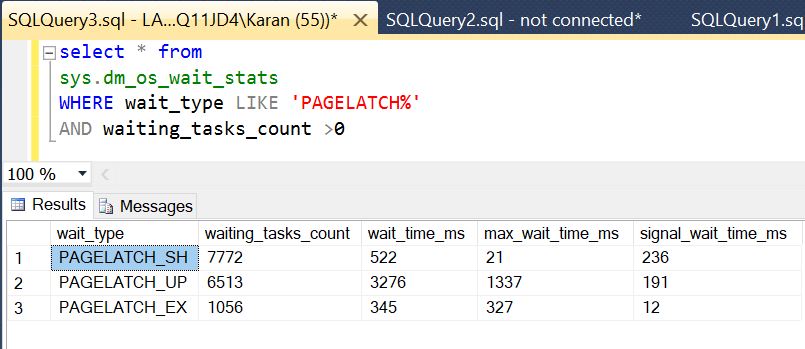
Let’s take an example
We have used SQLTREEO sample database above to run an example of rebuild index statement, which will rebuild all the indexes on the Production.Product table.
NOTE:-
Keep in mind when running rebuild indexes on your database and tables in production, it is an I/O and resource-intensive operation and should typically be scheduled during off-peak business hours or during scheduled maintenance/outage windows. Online indexing, however, can take place without affecting normal database operations because this feature does not lock the tables, as with traditional index rebuilds. Of course, this feature is available only in Enterprise Edition and comes with the cost that online indexing will take longer to complete and require sufficient tempdb space.
2)Reorganize Index
The index reorganization process physically reorganizes the leaf nodes of the index. Reorganizing an index uses minimal system resources. It defragments the leaf level of clustered and nonclustered indexes on tables and views by physically reordering the leaf-level pages to match the logical, left to right, order of the leaf nodes. Reorganizing also compacts the index pages.
Unlike rebuilding indexes, reorganizing indexes does not require any additional disk space but requires log space. Because reorganizing indexes is a fully logged transaction, the log can potentially grow substantially. Log usage for a reorganize could be way more than the size of the index, which depends on how much reorganizing and compaction is done, as well as the level of fragmentation distributed through the index.
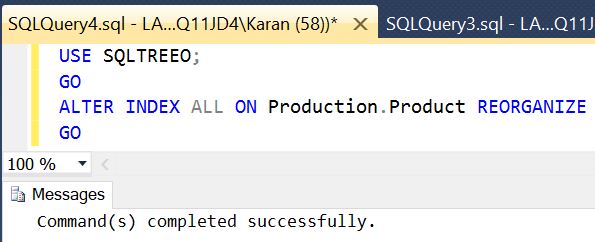
We have used SQLTREEO sample database above to run an example of reorganize index statement, which will reorganize all the indexes on the Production.Product table.
Usual determination of the use of the REBUILD/REORGANIZE :
- When the Fragmentation percentage is between 15-30: REORGANIZE
- When the Fragmentation is greater than 30: REBUILD
Reasons for Index Fragmentation.
One particular commonplace operation you should be aware of that causes index fragmentation is running shrink database and data file operations.
1)Running the DBCC ShrinkDB operation will itself cause index fragmentation and incur significant overhead in performance. As there are data and log files that could potentially be shrunk in size, DBCC Shrinkfile can individually shrink the data or log files, depending on the specified parameters.
2) Shrinking log file is more acceptable than shrinking your data files.
3)The transaction log, if not properly managed, can and will grow out of control, often resulting in an outof-disk-space error and stopping database transactions in its tracks. You can use the command DBCC SQLPERF(LOGSPACE) to specifically return the log size and the percentage of space used.
Example of the DBCC SQLPERF(LOGSPACE) is below:-
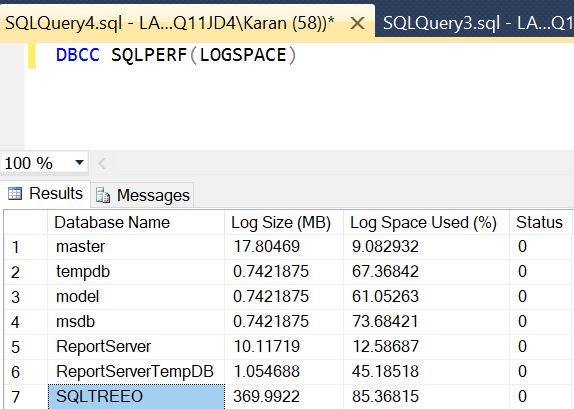
Here in the output above we can see that sample database SQLTREEO has logspace used 85%. Log truncation should occur either by checkpoint in case of database in simple recovery model or by log backup in case of Database in full recovery model.
The overall analysis is to minimize use of shrink operations on the database, unless you have to, in which case you can plan for some downtime and then remember to rebuild your indexes and leave sufficient space in the file after the shrink to allow for the rebuild.