Windows desktop

See what your SQL Server
Agent jobs really do

See which SQL Server Agent jobs overlap, which run longer than normal and what failed, across all your servers.

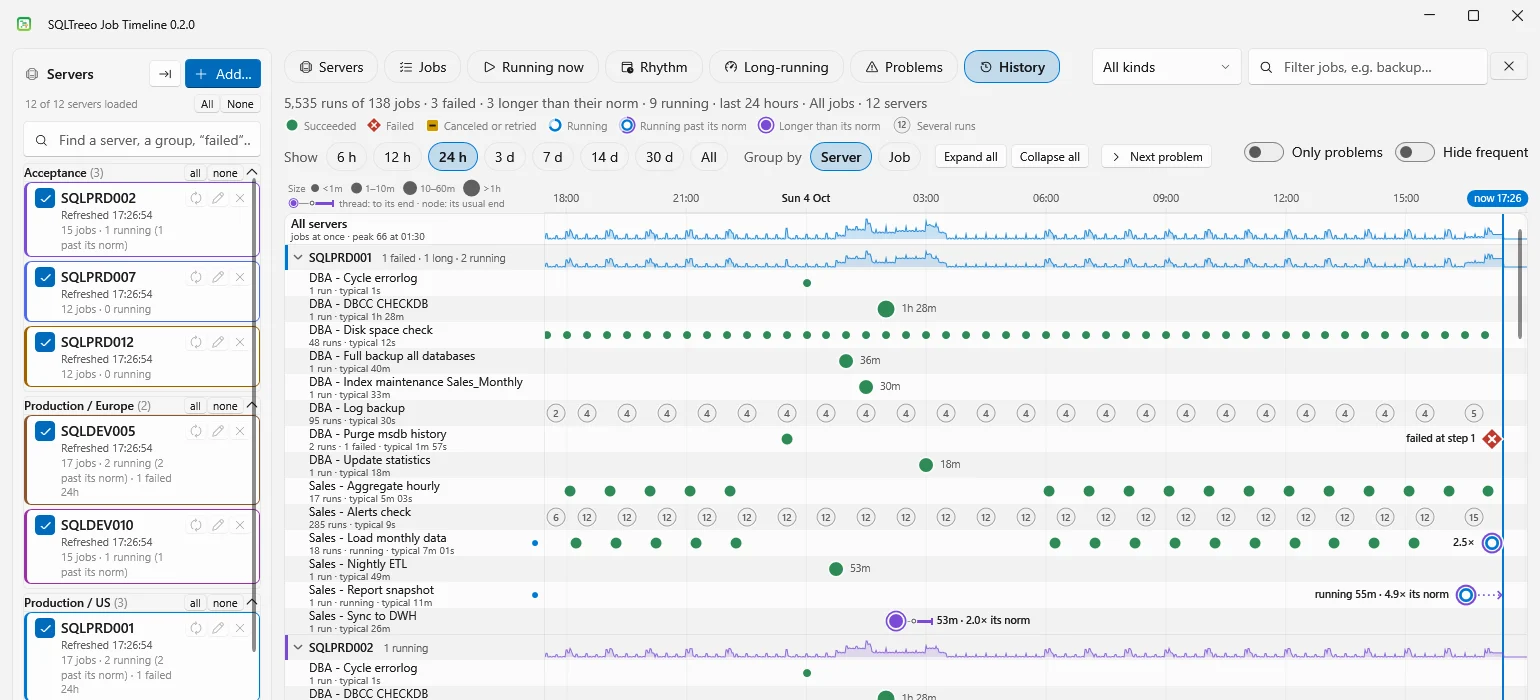
History view: one row per SQL Server Agent job with every run of the last 24 hours as a bead on a timeline, a failed run as a red diamond and a run longer than its norm as a purple bead

The History view: every run of every job in the last 24 hours, on one timeline. A bead is a run, where it started; its shape says how it ended and its size how long it took. The screenshots on this page show sample data.

Why

Three things SQL Server Agent does not show you

Job Activity Monitor shows one server and the last run. The history sits in msdb with dates and durations packed into integers. These are the questions that take hours to answer by hand.

Which jobs run at the same time?

Schedules are set one job at a time, so nobody sees them together. Backups, index maintenance and the nightly load end up in the same half hour, and each of them gets slower.

Which job is slower than it used to be?

A fixed threshold of an hour says nothing about a job that normally takes four minutes and now takes twenty. Every job is measured against its own history.

What happened last night?

What ran when, how long it took and how it ended, as a timeline you can read at a glance, with the failing step and its message one click away.

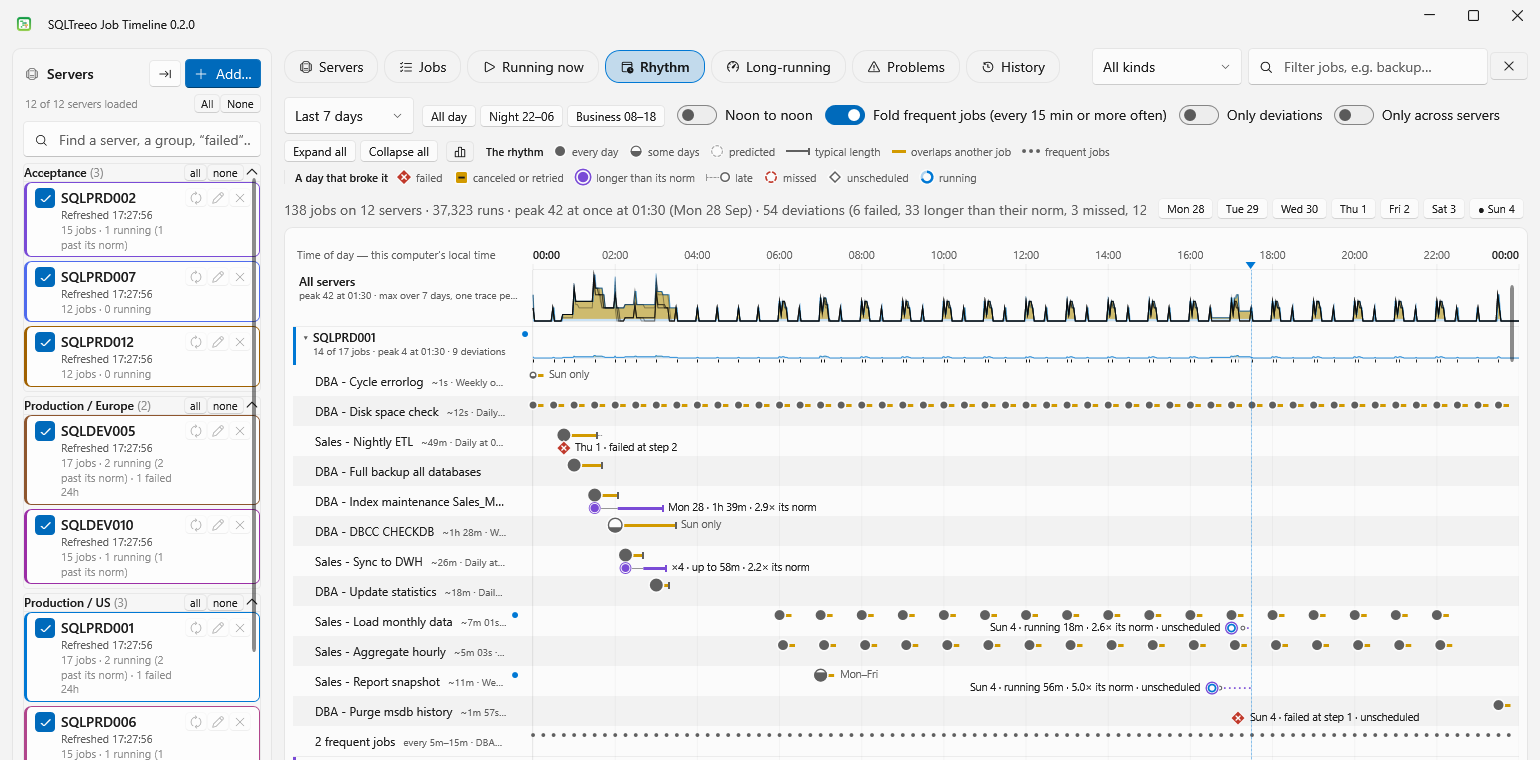
Rhythm view: the 24 hours of a day with the load of all jobs over the last 7 days, and per job one bead for its start time with the days that broke the rhythm named beneath it

Rhythm: a week of jobs folded into one day

Seven days of runs laid over one 24-hour axis. The peaks show when the server is busiest and how many jobs run at once. Per job one bead stands where it starts every day, and whatever broke the rhythm hangs under it with the day in words: a failure, a run longer than its norm, a late start, a run that is missing.

Only the exceptions carry color: a run that overlaps another job, one that ran longer than its norm, a failure, a start that was not on the schedule.
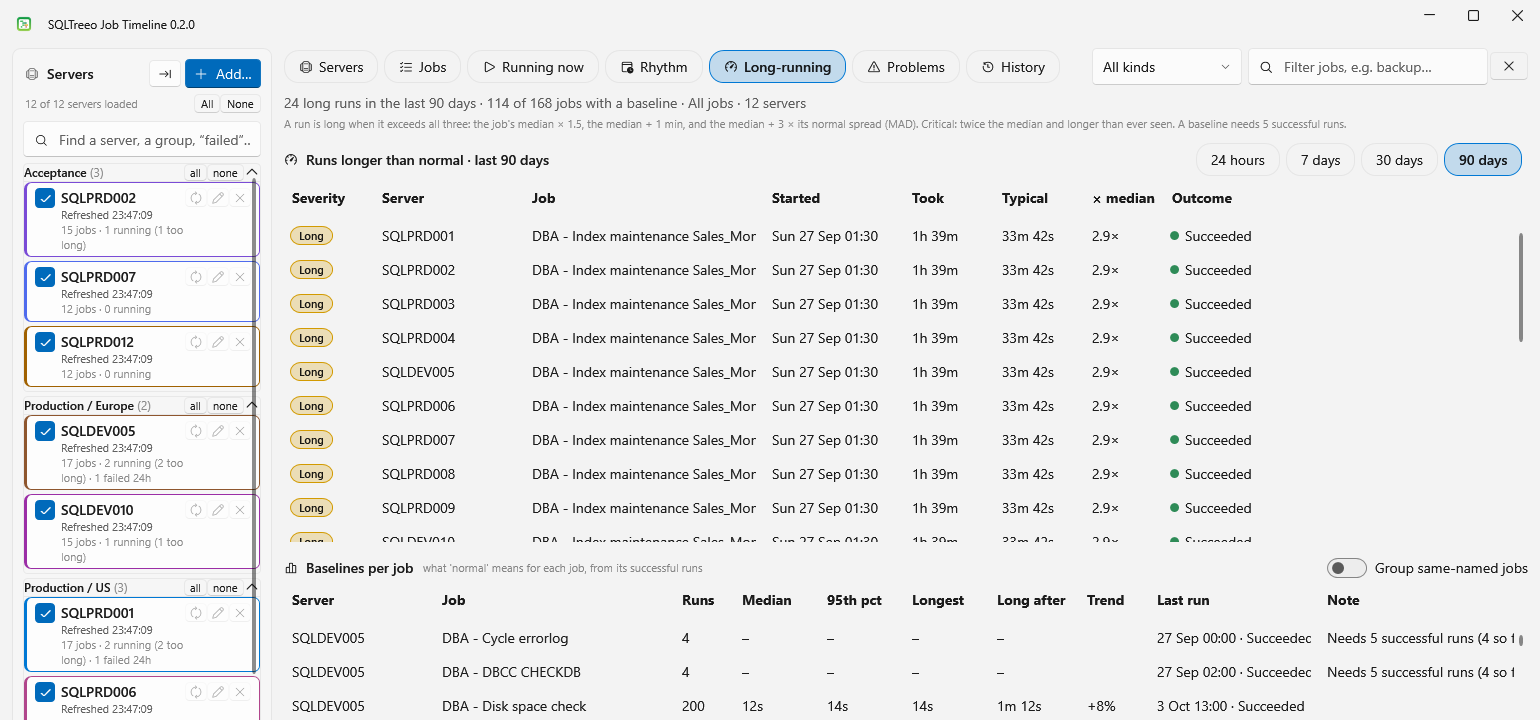
Long-running view: runs that took more than twice their median, and the baseline per job with median, 95th percentile and trend

Long-running, compared with the job's own norm

For every job a baseline from its successful runs: median, 95th percentile, longest run and the trend of the last runs. A run is flagged when it clearly exceeds that norm, and the rule is printed on the page so you can check it.

The same job on several servers can be put side by side, which shows the server where it takes twice as long.

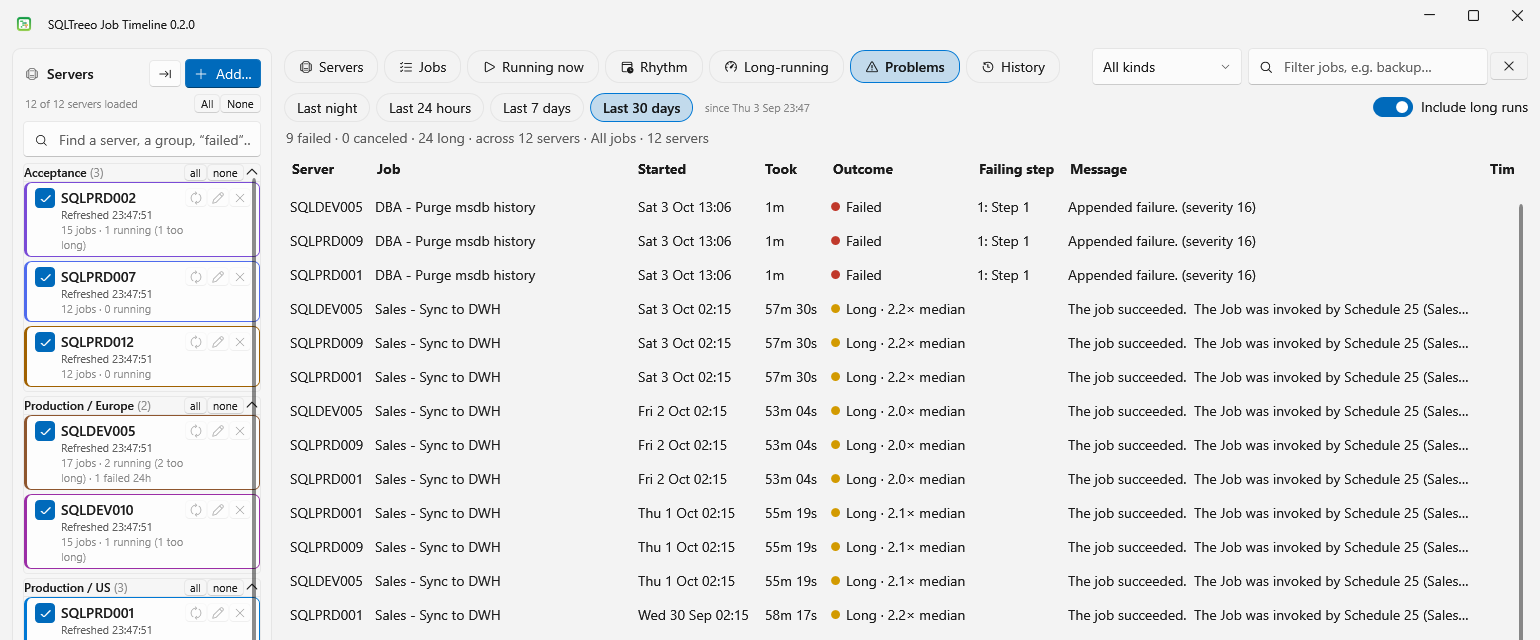
Problems view: failed and long runs of the last 30 days on twelve servers, with the failing step and its message

Problems, with the step that failed

Failed, canceled and long runs of last night, the last day, week or month. Each row names the failing step and the first line of its message, and counts how often that job had a problem in the period.

Select a row for the full message of every step, ready to copy into a ticket.

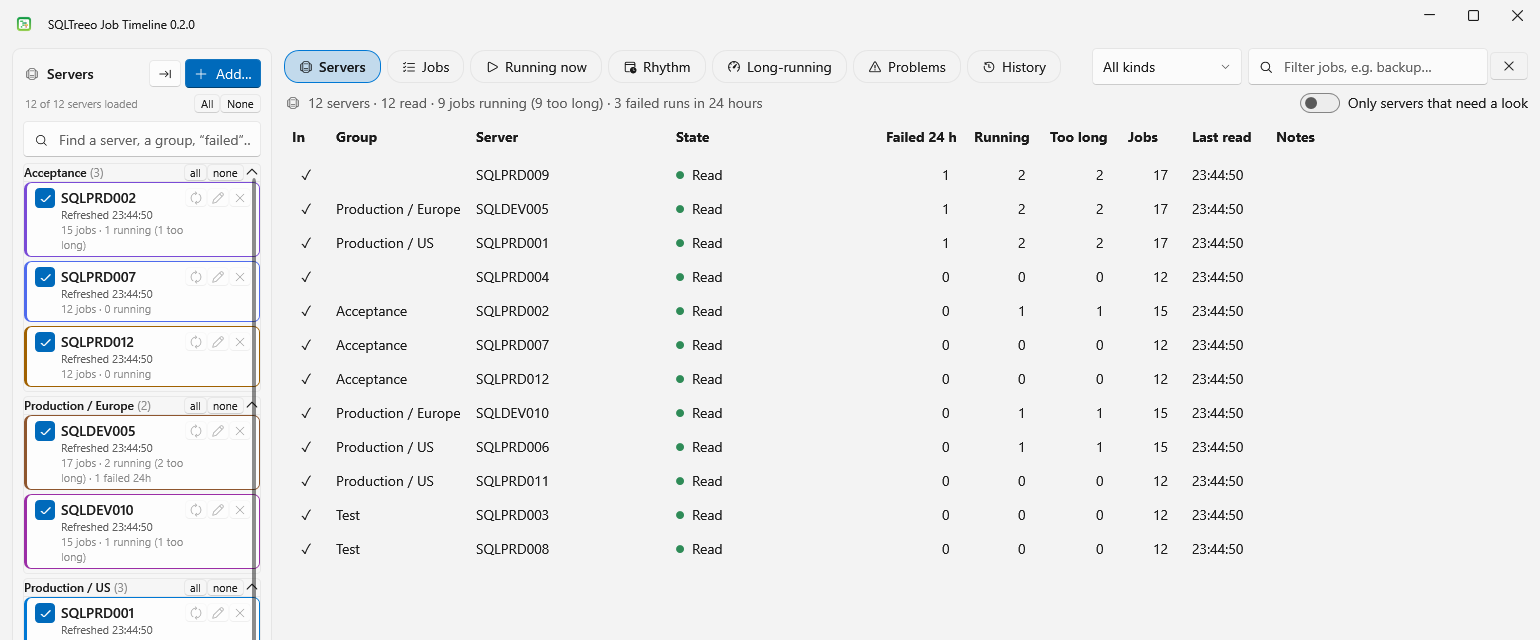
Servers view: one row per server with its group, state, failed runs in the last 24 hours, running jobs, jobs that run too long, number of jobs and the time of the last read

Servers: the whole estate on one page

One row per server: whether it was read, how many runs failed in the last 24 hours, what is running and what runs longer than normal. Servers that need a look sort first, and one switch hides the rest.

Groups keep production, acceptance and test apart. Double-click a server to see its jobs alone.

Read-only. SQLTreeo Job Timeline only sends SELECT statements: it reads the job tables in msdb and changes nothing. No jobs, no schedules, no objects on your server. Job definitions, job history, server names and passwords are never sent to SQLTreeo.
Seven views

One workspace for all your servers

Add your servers on the left, tick the ones you want to see, and every view shows them together with one shared filter.

Servers

One row per server, read or not: its state, failed runs in the last 24 hours, running jobs, number of jobs, last read, notes and availability group roles. What needs a look sorts first.

Jobs

What is defined where: schedule in plain words, next run, last run and its outcome, typical duration.

Running now

What is executing across the estate, for how long, and whether that is normal for that job.

Rhythm

The folded 24-hour picture of schedules and real runs, with the collisions and the busy periods.

Long-running

Runs that exceeded the job's own norm, and the baseline behind that verdict.

Problems

Failures with the failing step and message, for last night or the last 30 days.

History

The timeline of every run, grouped by server or by job, from 6 hours to everything that was read.

Many servers

Add them all at once

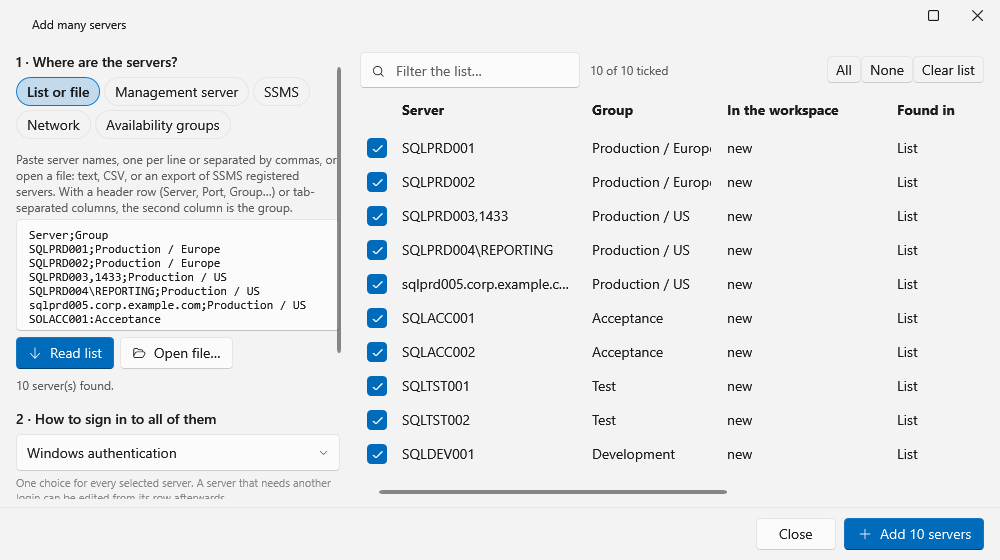
Add many servers reads server names from five sources and adds every ticked server in one run, with one sign-in. A source only reads names: nothing signs in to a server until you click Add.

List or file

Paste server names or open a file: text, CSV, or an export of SSMS registered servers. A header row and a group column are understood.

Management server

The servers registered on a Central Management Server, with their folder as the group. The login needs the msdb role ServerGroupReaderRole there.

SSMS

The Local Server Groups of SQL Server Management Studio for your Windows user. Names and groups only: passwords saved in SSMS are never read.

Network

The instances that answer the SQL Server Browser broadcast on your network segment. No addresses or ports are probed, and what answers is listed but not ticked.

Availability groups

The replicas and listeners that the servers already in the workspace report.

A wrong password stops early

With a typed login the first three servers are read on their own. When all three refuse the login, nothing else is tried.

Add many servers: a pasted list with a group column, read into ten servers that are ticked and ready to add with one sign-in

How to add many servers at once

Hundreds of servers

A long server list stays workable

The reading schedule and the views scale with the number of servers. This is tested with 300 made-up servers that were all played by one test instance; it has not been measured against hundreds of real servers yet.

Servers view

One sortable row per server, included or not, read or not. What needs a look sorts first, and one switch hides the rest. Double-click a server to see its jobs alone.

Groups

An imported server keeps the group from its source, or gets the one you type for all. The sidebar shows the groups as headers that collapse, with all and none, and a menu to show only that group.

Filter

Above 8 servers the sidebar has a filter box. Type a server name, an instance name, a group or the name of an availability group. The words failed, note, running, excluded, primary, secondary and contained, typed in full, select by state or role. Above 20 servers each server is one compact line.

Reading schedule

By default between 8 and 32 servers are read at the same time, depending on the size of the workspace. Running jobs are checked every 30 seconds and every server is read in full every 10 minutes; in a very large workspace both intervals stretch. Settings shows what they come to for your number of servers.

Servers that fail

A server that cannot be reached is retried later, less and less often. A server that was never read and refused the login is not retried automatically, because repeated failed logins lock accounts. One that was read before is retried once an hour.

Export

The export button writes names and groups, nothing else: no logins, no passwords. A colleague opens the file with List or file and signs in with their own account.

Good to know

Where it stands

Windows desktop application

Windows 10 or 11, 64-bit, no .NET installation needed. The installer is per user, needs no administrator rights and updates itself; a portable zip runs without installing. Same look and handling as SQLTreeo Compare, including saved connections with Windows, SQL Server and Microsoft Entra ID authentication.

Availability groups

Classic and contained availability groups are supported, also through a listener. Jobs that live inside a contained group are read from the group's own msdb and shown once; after a failover they are read from the new primary. So far the tool has run against one real contained availability group, in which all jobs were instance jobs. Reading jobs stored inside a group is covered by automated tests with a simulated group, and a failover has not been observed on a real system yet. Comparing the replicas of a group with each other is not built yet. Availability groups

Permissions

Membership of db_datareader in msdb is enough to read the jobs. On a server with availability groups, VIEW ANY DEFINITION lets the login see the groups and VIEW SERVER STATE adds the replica roles. Without them the tool still works: it puts a note on the server and shows the role as unknown. Nothing is installed on the server. Permissions

History archive

Agent keeps a limited number of history rows. The tool keeps the runs it has read in an archive on your computer, so baselines and the timeline look back further. The archive is kept per Windows user on one PC; it is not shared with colleagues.

What it does not do

It shows what the jobs do; it does not act on them. It sends no alerts, it is not a monitoring service, and it does not start, stop or change jobs.

Diagnostics report

When a server is not shown as you expect, Settings writes a plain-text report for support. It never contains passwords, connection strings, job step commands or job history messages, and an option replaces server, availability group, database, job and login names by placeholders. Diagnostics

Pricing plan

Try it free for 30 days

Free trial

Free
30 days, every feature
  • Starts automatically on first launch
  • Every view, any number of servers
  • After the trial: free for up to three servers
Download

Named User license

$99
about €87
per named user, for 1 year
  • Any number of servers
  • Add many servers at once
  • One person, up to three computers
  • All updates during the term
  • Support
Buy now

After the trial the tool stays free for up to three servers. A license key is for one person, on up to three computers. How the trial and license keys work.

Ready to see your own jobs?

Download SQLTreeo Job Timeline, add a server and open a view. The trial starts on first launch and covers every feature and any number of servers.

By installing SQLTreeo Job Timeline you accept the end-user license agreement.