
Getting started
Install SQLTreeo Job Timeline, add your first SQL Server instance and find your way in the seven views of its Agent jobs.
SQLTreeo Job Timeline is a Windows desktop application that shows the SQL Server Agent jobs of many servers together: what runs now, which jobs overlap, which run longer than their own norm and what failed. It only reads from your servers and installs nothing on them.
Install
- Download the installer from the downloads page and run it.
JobTimeline-win-Setup.exeinstalls per user, so no administrator rights are needed, and it carries its own .NET runtime. A portable zip is available as well: extractJobTimeline-win-Portable.zipanywhere and startSQLTreeo Job Timeline.exe. - Start SQLTreeo Job Timeline. The first start creates a 30-day trial on the computer, with every feature and any number of servers. Afterwards the application stays free for up to three servers, see Trial and licensing.
- The installed application checks for updates at startup and periodically while it runs. A banner offers the new version: Update now downloads it and Restart and install finishes the update. You can switch the automatic check off under Settings → Updates. The portable version does not update itself.
Requirements: Windows 10 or 11, 64-bit. Target servers: tested with SQL Server 2019 and SQL Server 2022.
Settings open with the gear button at the bottom of the server list.
Add your first server
- Click Add your first server…, or Add… above the server list. The Connect to SQL Server dialog opens.
- Type the server name, for example
SQL01,SQL01\INST1ortcp:SQL01,1433. Connect to the instance whose jobs you want to see. Jobs of contained availability groups on that instance are included automatically. - Choose the authentication: Windows authentication, SQL Server authentication, or Microsoft Entra ID (interactive with MFA, integrated, or default credential).
- With SQL Server authentication you can tick Remember password. The password is then saved encrypted with Windows Data Protection for your Windows user account. A saved password is never shown and never loaded back into the box; leave the box empty to keep it.
- Advanced holds the encryption options (encrypt the connection, trust the server certificate) and the connection timeout.
- Press Test connection. It connects and checks whether the login can read the job history in msdb. When it cannot, the message says so: the login needs
db_datareaderin msdb, see Permissions and what is read. - Press Connect. The server appears in the list on the left, and its jobs, schedules and history are read.
Connections you used are remembered, so the next time you can pick one under Saved connections at the top of the dialog. At the next start the ticked servers in the list are read again when that needs no prompt. A server whose password was not saved shows a Connect… button.
To add tens or hundreds of servers in one run, see Add many servers at once.
The seven views
The buttons above the main area switch between seven views of the same servers. The Servers view lists every server; the other six show the servers that are ticked in the list.
The screenshots show sample data: twelve made-up servers in four groups.
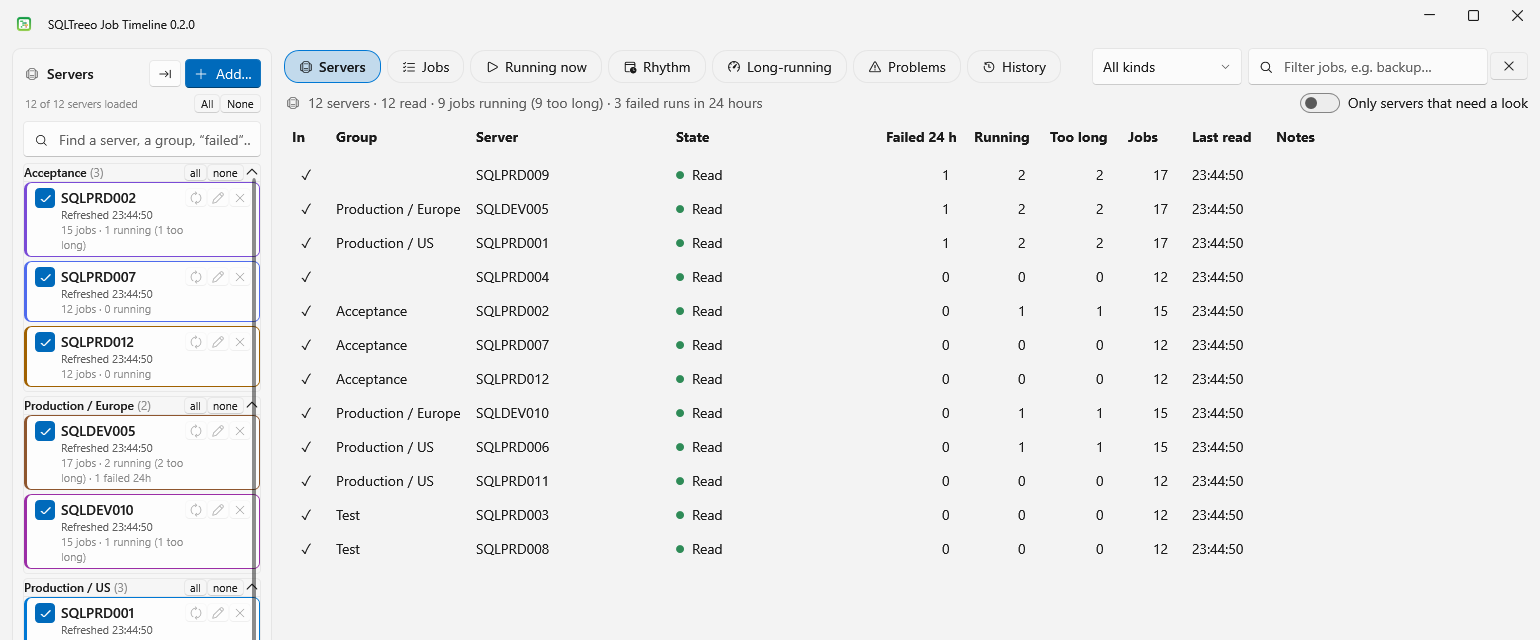
Servers: how is every server doing?
One row per server, read or not: state, failed runs in the last 24 hours, running jobs, runs that take too long, number of jobs, time of the last read, notes, availability group roles and version. What needs a look sorts first. Double-click a server to see its jobs alone; the other servers are then unticked.
Jobs: what is defined where?
Every job with its schedule in plain words, next run, last run with duration and outcome, typical duration, number of steps and the availability group it works for. The switches Only enabled, Only scheduled and Last run failed narrow the list.
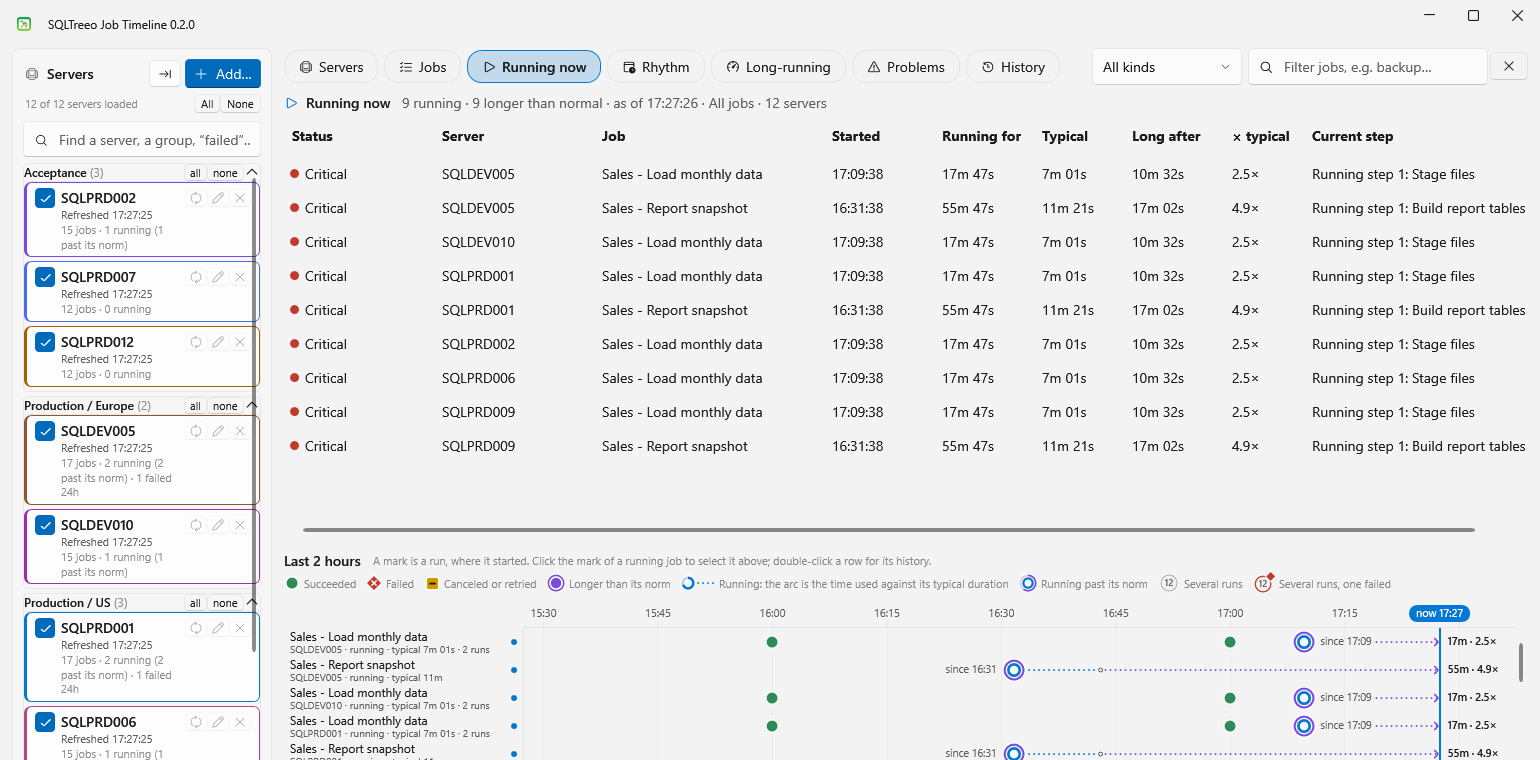
Running now: what is executing, and is that normal?
Each running job with its start, how long it has been running, its typical duration and the moment after which it counts as long. The status is Normal, Longer than normal, Critical or No baseline. Below the list the last 2 hours show every run as a bead where it started, and every running job as a ring whose arc is the time it has used against its typical duration. A ring turns purple once the job is past its norm. Elapsed times are measured at the last refresh, not live.
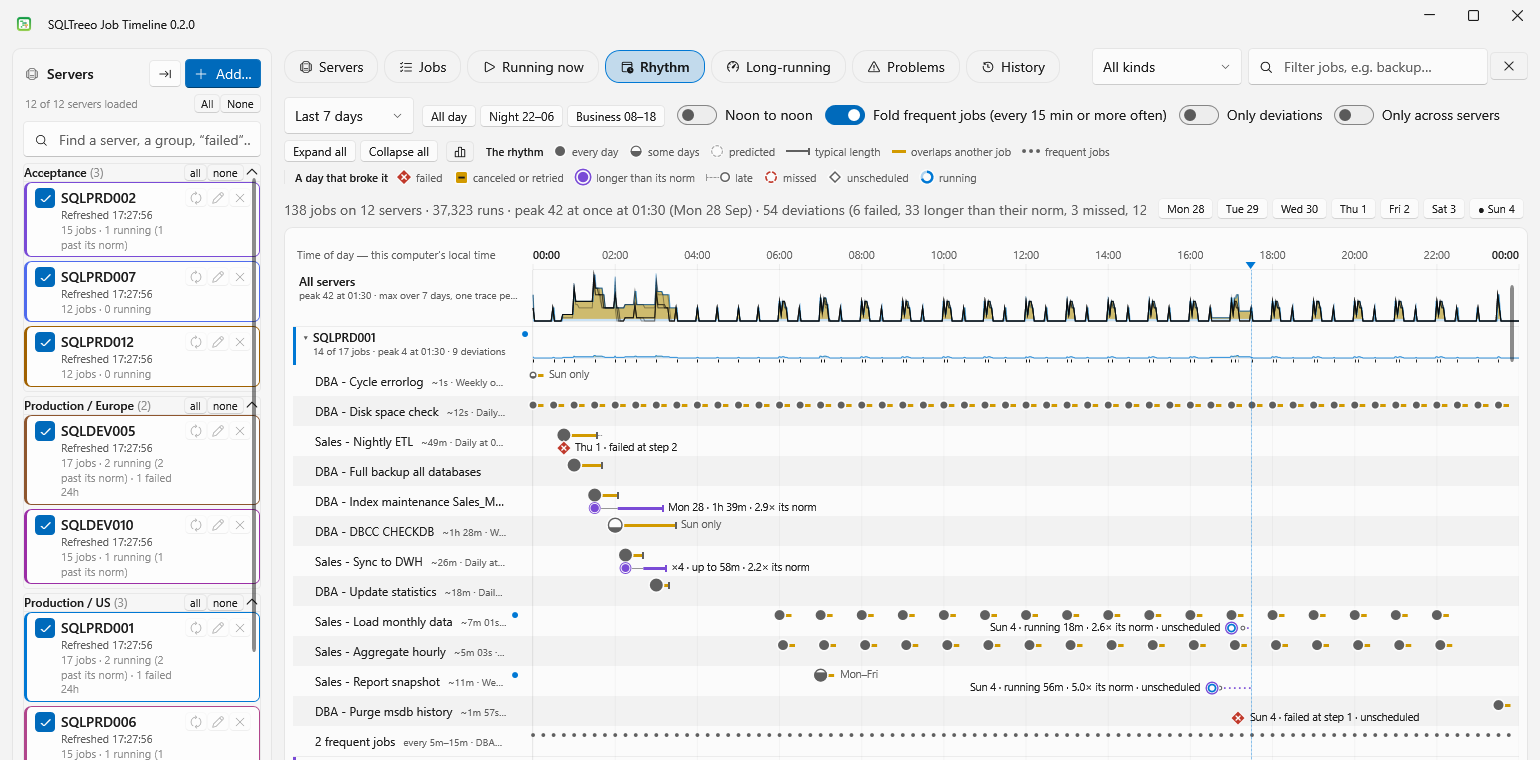
Rhythm: which jobs run at the same time?
The days of the chosen window (the last 24 hours, 7, 14 or 30 days, or the next 7 days) are folded onto one 24-hour axis. The band at the top shows how many jobs run at once. Per job one bead stands where the job starts every day. A job that runs on some days only gets a half-filled bead and says which days, for example “Sun only” or “6/7”. Whatever broke the rhythm hangs under the bead with the day in words: a failed run, a run longer than the job’s norm, a start that was late, a run that is missing, a start that was not on the schedule. Where a job overlaps another job its line turns amber. Hover a bead for the list of its days, click it to see the days one under the other. The panel on the right lists the busy periods and the pairs of jobs that overlap.
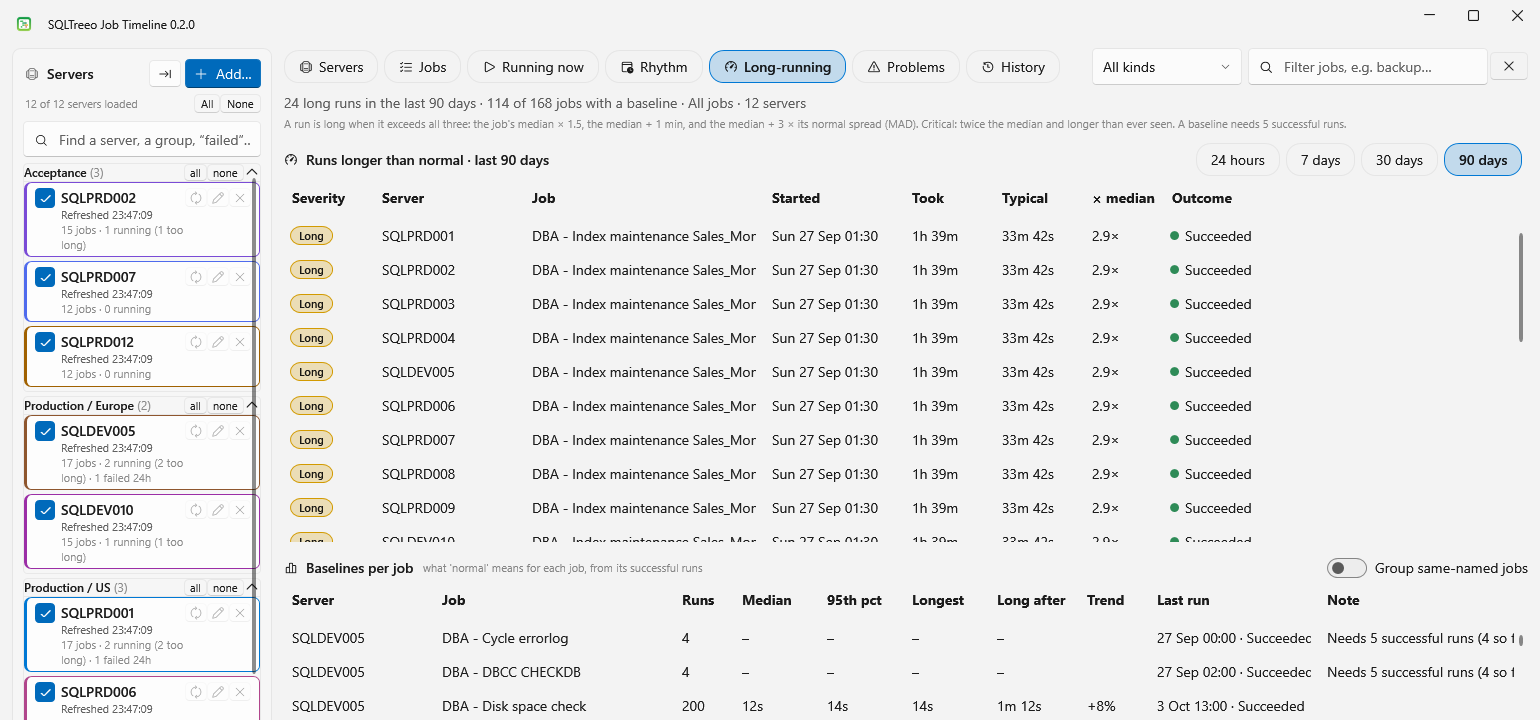
Long-running: which runs took longer than the job’s own norm?
The long runs of the last 24 hours, 7, 30 or 90 days, and below them the baseline of every job: number of runs, median, 95th percentile, longest run, the duration after which a run is long, and the trend. The rule is printed at the top of the view and explained in Job history, baselines and long runs.
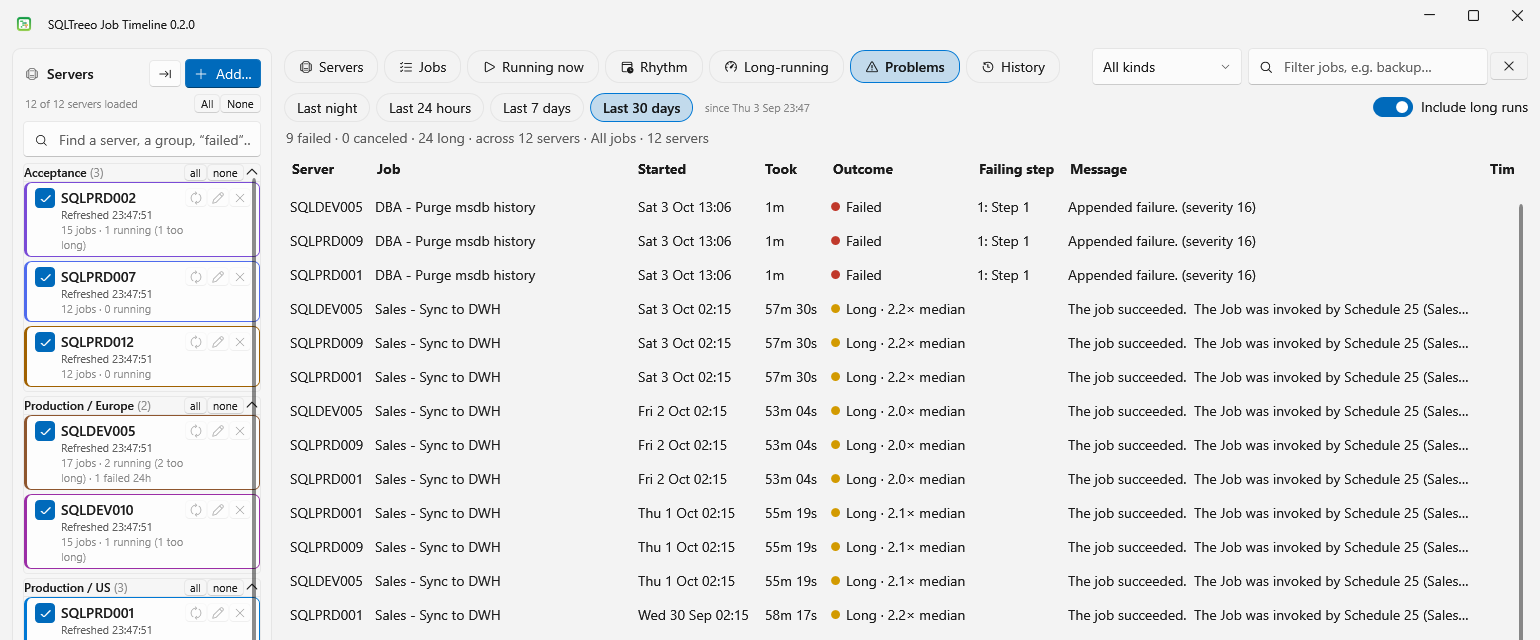
Problems: what failed and why?
Failed, canceled and retried runs of last night (18:00 to 08:00), the last 24 hours, 7 days or 30 days. Each row names the failing step and the first line of its message, and counts how often that job had a problem in the period. Include long runs adds successful runs that took far longer than the job’s norm. Select a row for the message of every step; Copy puts it on the clipboard.
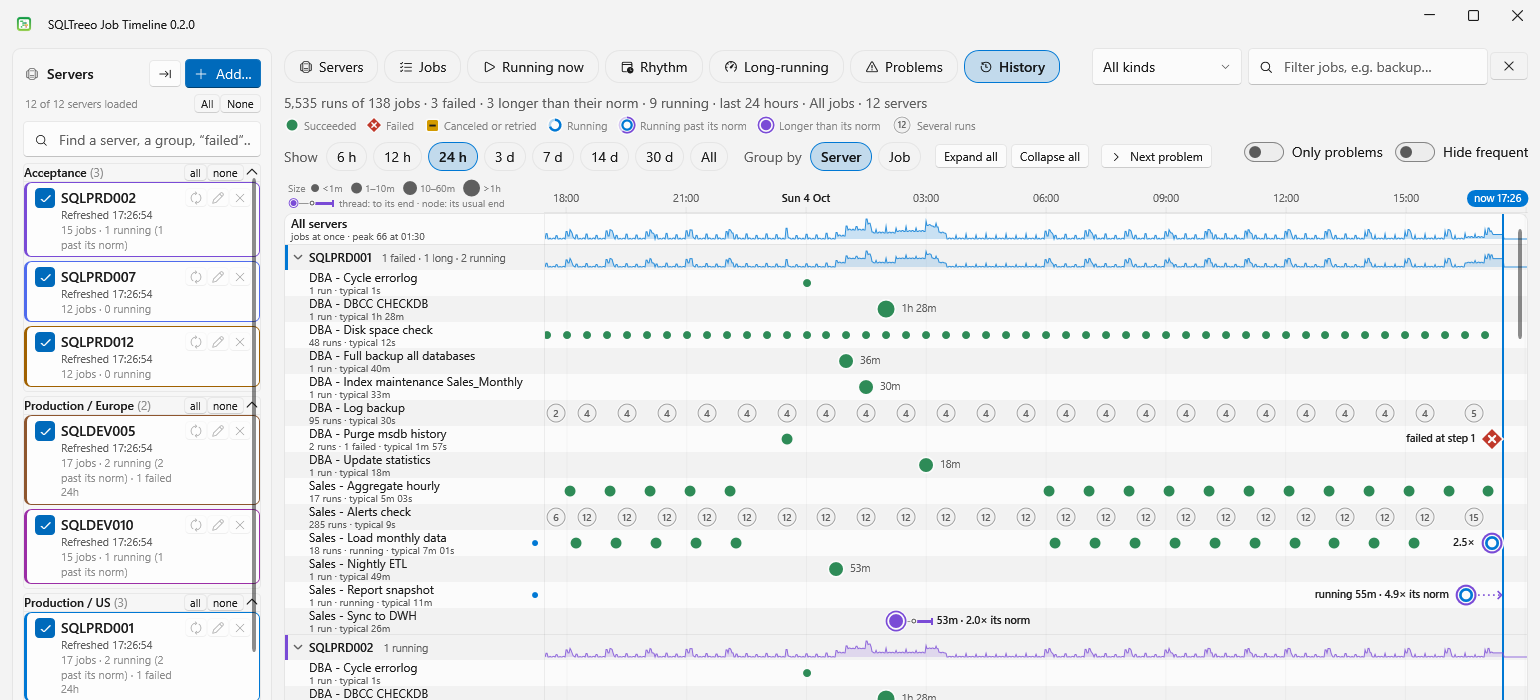
History: what ran when?
A timeline with one row per job. Every run is a bead where it started. The shape says how it ended: a green dot succeeded, a red diamond failed, an amber square was canceled or retried, a ring is still running, and a purple bead with a halo took longer than the job’s own norm. The size says how long it took, in four classes, and beside the bigger beads you read the duration. Runs that start close together, such as a job every five minutes, merge into one ring with their number in it; a ring that holds a failed run carries a red mark. The range goes from 6 hours to 30 days, or All for everything that was read from msdb and the local archive. Rows are grouped by server or by job, so the same job on every server sits together, and a server can be collapsed to one row that shows only what needs a look.
Click a bead for the steps of that run and their messages. Click a ring for the list of its runs. Next problem (or the N key) jumps from one failed, longer-than-normal or running run to the next, also across servers; the arrow keys move from mark to mark, Enter opens a run and Esc steps back. Ctrl and the mouse wheel, or a drag on the time axis, zoom in.
Double-clicking a job in Jobs, Running now or Problems opens the History view focused on that job. Same job on all servers then widens the focus to every job with that name.
The shared filter
The kind picker and the text box at the top right apply to every view.
- The text box filters on the job name. Type
backupto see only the jobs with backup in their name. - The kind picker selects full and differential backups, log backups, index maintenance, integrity checks, statistics, or other jobs. The kind is derived from the step commands, on the server.
The filter also restricts the overlap analysis in the Rhythm view: with backup typed, Rhythm shows which backups run at the same time. The button next to the text box clears the filter.
Including and excluding servers
Every server in the list has a checkbox. Ticked servers feed the views; the others stay in the list and can be ticked again at any time. All and None above the list tick or clear every server. Right-click a server for Only this server, Refresh, Edit connection… and Remove from workspace.
While the application is open, running jobs are checked every 30 seconds and every server is read in full every 10 minutes. Both intervals are under Settings → Reading the server. In a very large workspace they stretch (with the default settings, the 30 seconds above 500 servers and the 10 minutes above 1,000), and the same page says what they come to. Refresh all below the list reads every included server now. The automatic refresh pauses while the window is minimized.
Time zones
All times are shown in this computer’s local time, so servers in different time zones line up on one axis. A server in another time zone shows its zone or UTC offset in the server list, and a server whose clock differs more than two minutes from this computer says so.
Under Settings → Reading the server → Time base you can choose each server’s own clock instead, as SSMS shows it. That choice is used only while a single server is included.
No job definitions, job history, server names, connection details or passwords are sent to SQLTreeo. Only the license check and the update check contact the internet, and both are described in the license agreement.
Next steps
- Add many servers at once from a list, a Central Management Server, SSMS or the network.
- Permissions and what is read, with a script for a dedicated login.
- Jobs in availability groups, including contained availability groups.
- Job history, baselines and long runs.
- Trial and licensing to activate a purchased key.
- The diagnostics report when something does not work as expected.